

Although we know we live in a data rich world, there is an important difference between data and information. Data is – in effect – the inert, raw material that makes up the background noise of our digital lives. Data is everywhere you look. In fact, we are mired in data.
Imagine you have lost your way in a dense woodland. The horizon is obscured, your goals are blanked out behind a never ending density of jungle, and your way out of the gloom is far from clear. Not being able to see the wood for the trees is what happens when there are simply too many trees in your line of sight. Those trees are like the myriad points of data that envelop us 24/7.
In the same way that a few marked trees might point to a pathway out of the forest, grasping the right data – the sort that we could capture, process and use as hard information – is the way to set your business on a path to broader horizons and more clearly defined and more focussed goals.
Out of the jungle
To bring this analogy up to date, modern business is innately data rich. Like the trekker who loses their bearings, we are surrounded and subsumed by so much data that it can be at best distracting and at worst wildly disorientating. We can all too easily find we’ve been making decisions based on insufficient or mis-prioritised data. It is only too common to set out on a false path and finish up lost, bewildered and dispirited. Half of all start-ups fold within their first five years.
Seeing the wood for the trees
In the business environment there are, of course, useful navigators who are expensively qualified to steer us in broadly the right directions – accountants, lawyers, marketing gurus and more. But those are merely local guides. They work within the limits of their own specialist terrains. None of them are able to pull off that big-picture/micro-management trick of being able to pick out the right step to take at any one point in time.
The contemporary answer to this wholly 21st century dilemma is the sort of business intelligence dashboard provided by innovators such as Bilbeo Analytics. In contrast to the narrow breadth of vision offered by the established professions, what Bilbeo analytics deliver is a dynamic, real-time dashboard of the key performance indicators of any business.
Keeping what’s round the corner in view
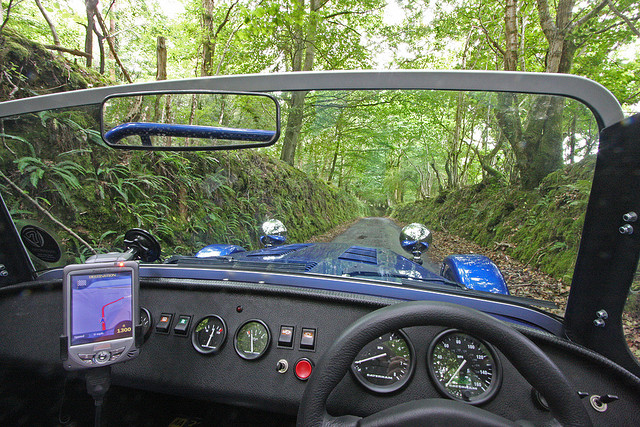
By feeding key data streams – sales, cash-flow, stock levels, material and prices – in fact whatever quantifiable data is identified as necessary information – into a desktop dashboard it provides the means to cut through the chaotic density of the data jungle and to retain a clear-sighted grasp on the most important data. As a business tool it lends itself to any number of useful analogies – a sat nav for decision makers, a dashboard for those balancing the stresses and strains of different parts of an organization, and most simply, a window on the business’ key performance indicators.
More and more expanding concerns are turning to business intelligence solutions to make decisions based on solid information rather than mere data. Those who don’t are still crashing about blindly in the undergrowth and trusting to luck and simply hoping for the best. Someone should tell them – it’s a jungle out there.